Positional auto-correlation function
The calculation can be performed with X-PLOR, but X-PLOR will not cooperate with DCD files containing unit cell information. You will have to use the old version of catdcd to prepare a new DCD file containing no unit cell information. Assuming that you did that, prepare an X-PLOR script similar to this
structure @RWTDQ.psf end

dynamics analyze correlation

  asci=false
  input=RWTDQ_2.dcd
  begin=270000 skip=10 stop=300000

  function=AC
  length=1000
  normalize=true
  output=corr_1.dat
  species=(not hydrogen)

end

stop
… and run it using input redirection. X-PLOR will insist to try to guess a time interval (in ps) between successive DCD frames, and its guess will almost certainly be wrong. You will have to look carefully at the output written-out by X-PLOR so that you can elucidate the connection between the values you give to length and what X-PLOR really uses for averaging.
Example
We will use a peptide simulation showing folding and unfolding events. The following diagram shows the evolution of the distances between the terminal Cα atoms as a function of simulation time:
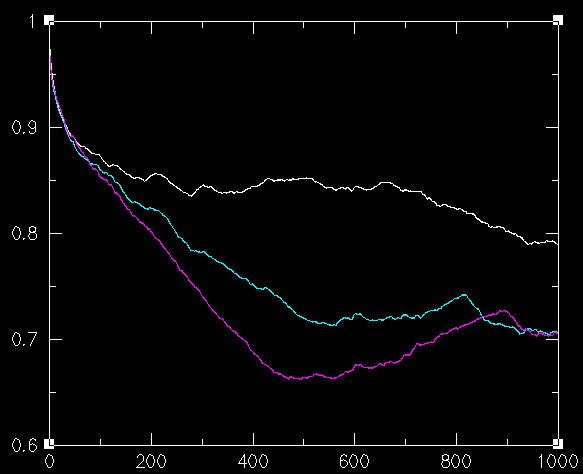
You can see the folding event taking place at frame ~260,000. We now calculate four positional autocorrelation functions: the first starts at 240,000, the second at 250,000, the third at 260,000, and the last one at 270,000. As you go from 240,000 to 260,000 the correlation between structures from distant frames goes down (because of the structural difference between the folded and the unfolded peptide). Graphically:
where the order of the graphs (from the upper to the lower curve) corresponds to the functions calculated by starting at 240, 250 and 260K. As you go inside the folded conformation, the autocorrelation goes up again as expected. The following graph is the same with the previous one with the addition of a curve calculated by starting at 270K:


