Torsion-RMSD, calculation and applications
Following the idea of dihedral PCA, instead of calculating the Cartesian-based RMSD between two structures, you can calculate the RMSD between their torsion angles (possibly including the χ1 angles as well). As with dPCA, the nice thing about this t-RMSD is that you do not have to least-squares superimpose the structures. This in turn makes the method suitable even for highly flexible systems.
The calculation of t-RMSD matrices has been implemented in carma (and will publicly appear in version 1.8 of the program). The invocation of the feature is through the -tcross flag and requires a SEGID definition (as with dPCA). The program also accepts the -chi1 flag to include the χ1 angle in the calculation. The resulting matrix is named carma.t-RMSD.matrix and the units is the RMSD (in radians) of the distances (in Ramachandran space) between successive pairs of torsion angles.
An application of t-RMSD matrices to quantify differences between two independent trajectories has already been discussed here.
First example
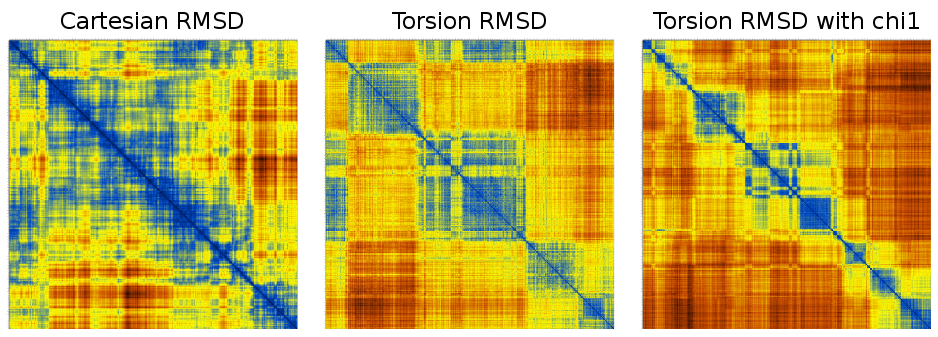
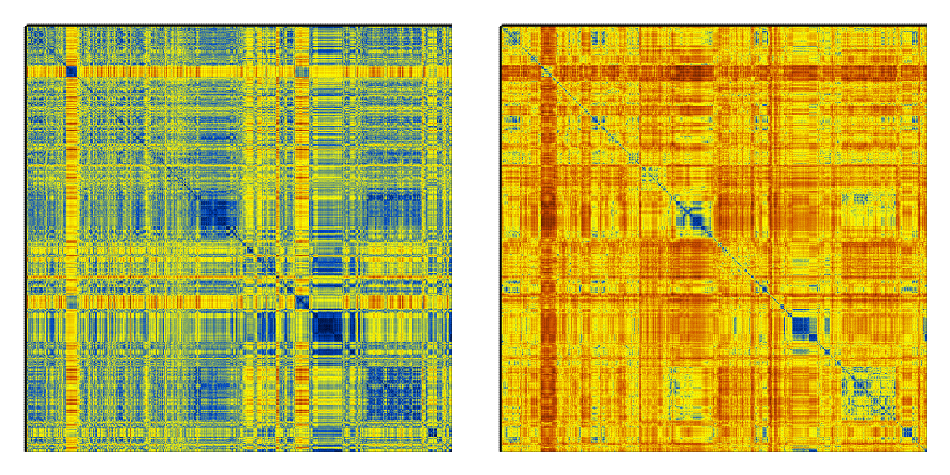
This is just 1000 frames from a folding simulation of a 19-residue peptide (the command line for the t-RMSD calculation was carma -v -segid A -tcross tfe.dcd tfe.psf ) :
Notice how much sharper the matrices from t-RMSD appear to be (considering also that the Cartesian RMSD matrix was calculated using all backbone atoms to maintain consistency with the t-RMSD calculation).
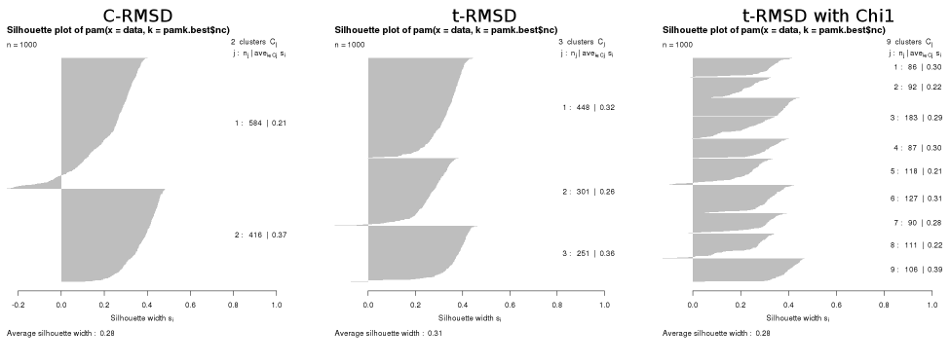
Naturally, the results from a matrix-based automatic cluster determination (as described here) also differ :
For completeness, the results from PCA-based clustering of these same 1000 frames gave 2 clusters for CPCA, 3 clusters for dPCA, and 4 clusters for dPCA+χ1.
Second example
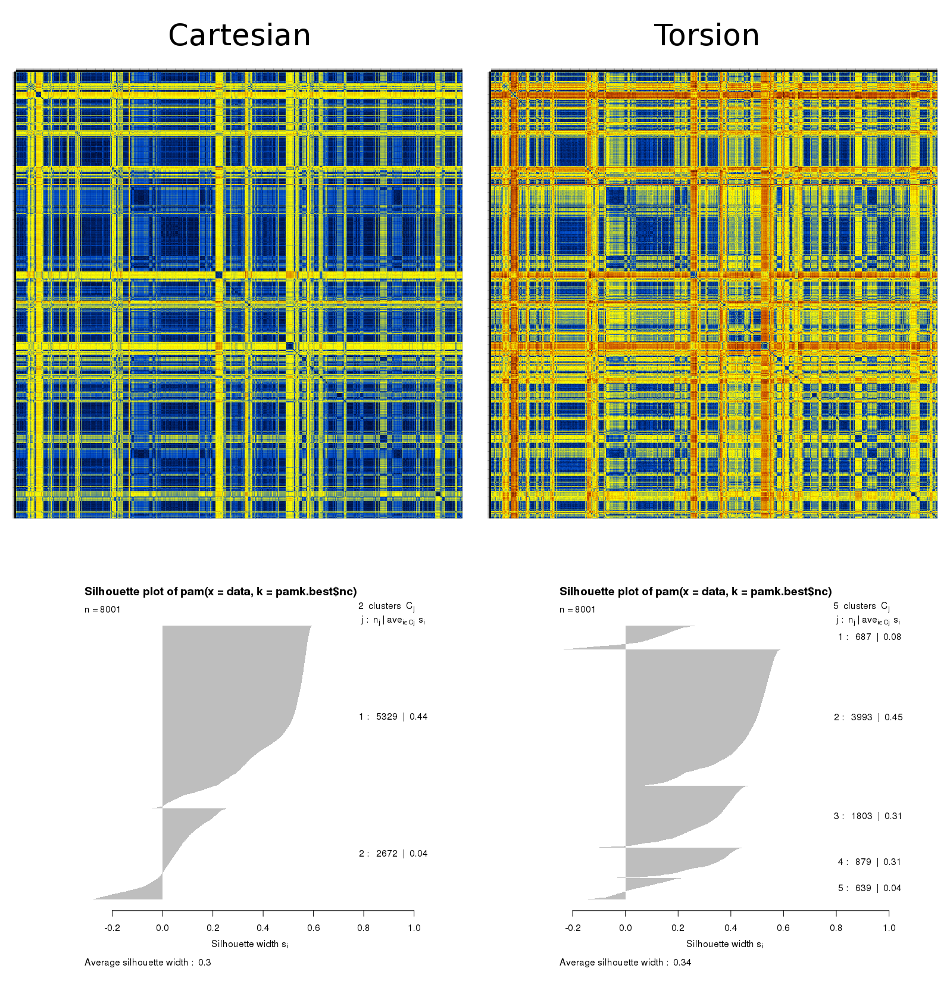
This is based on a folding simulation of a 19-residue peptide. The results shown below were obtained from a dcd containing 8 million structures for which the corresponding adaptive tempering temperature was less than 320K. The step for the matrices' calculation was 1,000 structures (resulting in 8000×8000 matrices). Only the more well-ordered central 9 residues have been used for the calculation. The C-RMSD and t-RMSD matrices plus the results from the automatic k-means-based clustering are :
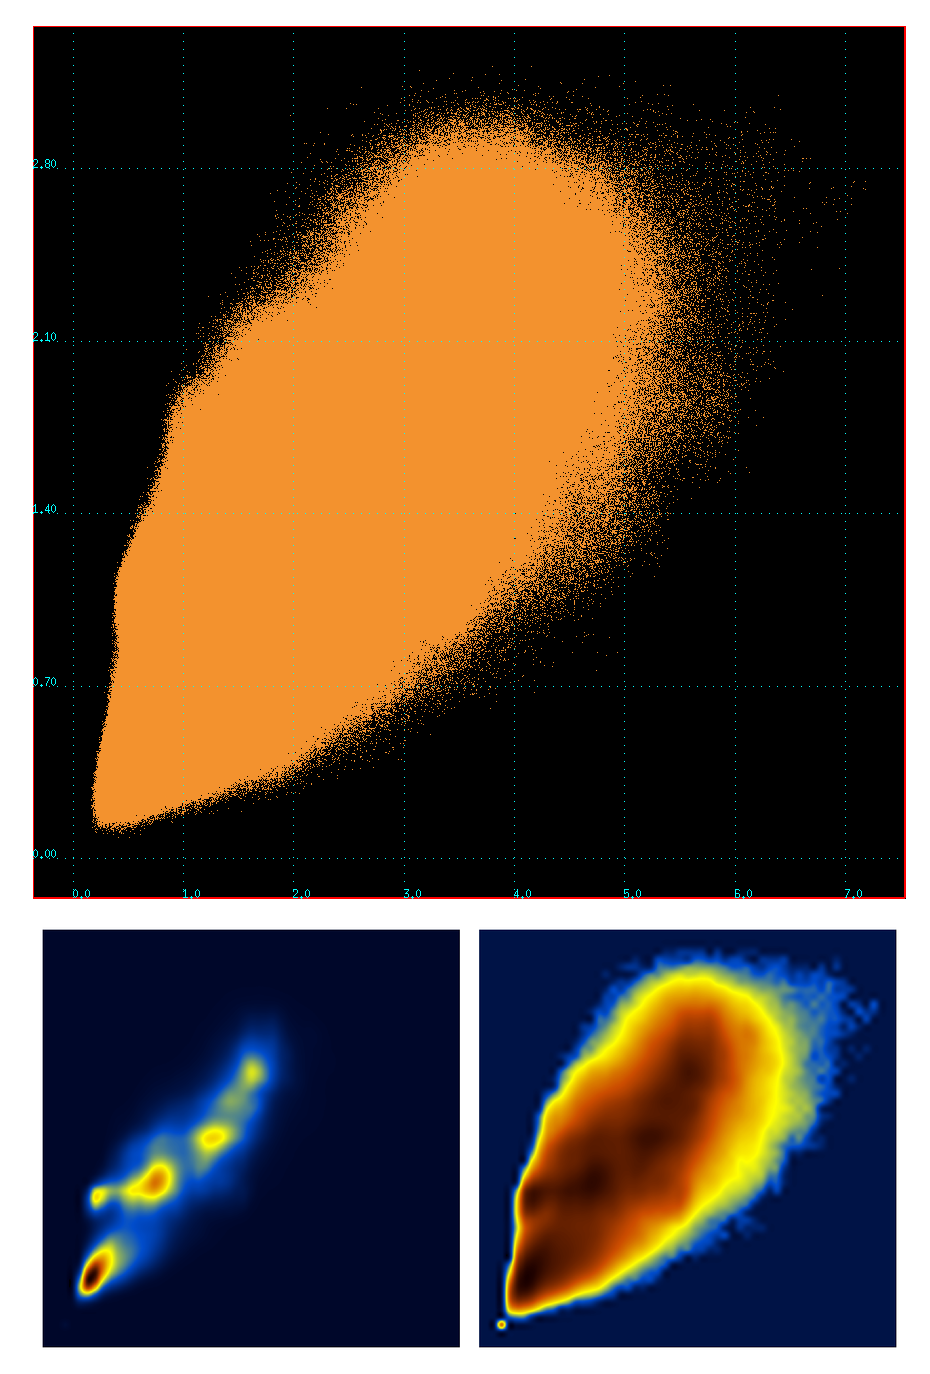
To visualize the correlation (~0.84) between the two metrics (C-RMSD vs t-RMSD), a scatter plot of the values contained in these two matrices was calculated (~64 million points). The plot together with the corresponding density and log-density distributions are :
Notice the presence of fine structure in the density plots. I have no idea where this is coming from. Well, actually, I do have an idea : these matrices were calculated for the stably folded part of the peptide, which means that there are stable peptide conformations that are being visited again and again. This 'fine structure' may actually represent stable peptide conformers, ie what we usually call 'clusters'.
Finally, a comparison of the matrices for a straight 10 μs run from the same trajectory (and using all residues) looks like this :


