Adaptive tempering : Secondary structure vs. temperature diagrams
Start from a file containing stride assignments and corresponding temperatures (“C” means un-assigned state) :
TTBTTTBTTTTTTCC 315.5753
TTBTTTBTTTTTTCC 302.3736
TTBTTTBTTTTTCCC 305.8445
TTBTTTBTTTTTCCC 296.2048
CCTTTTTTTTTTCCC 316.5841
TTBTTTBTTTTTCCC 322.6407
TTBTTTBTTTTTCCC 316.7581
.........
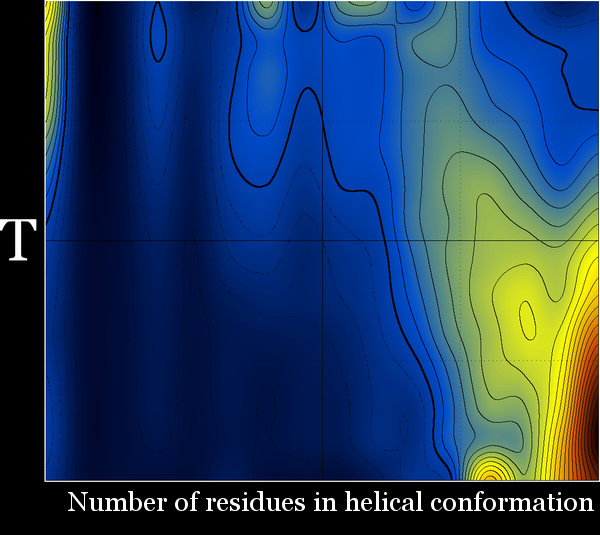
The program that follows calculates a matrix containing the fraction of helicity for each residue (horizontal axis) as a function of temperature (vertical axis). You'll have to modify this for different number or types of secondary structure states.
Fraction helical per residue vs. temperature
Running this program will give a matrix that will look something like this :
 0.2601 0.3237 0.3931 0.4624 0.5434 0.5838 0.6127 0.6474 0.6590 0.6821 0.6127 0.5549 0.4046 0.2659 0.1850
 0.2813 0.3581 0.4319 0.4970 0.5798 0.6556 0.6837 0.6944 0.7037 0.7222 0.6835 0.5919 0.4715 0.3400 0.2030
 0.2949 0.3708 0.4413 0.5053 0.5923 0.6753 0.6979 0.7187 0.7269 0.7411 0.6930 0.6067 0.4765 0.3408 0.1926
 0.3104 0.3854 0.4607 0.5216 0.6168 0.7025 0.7307 0.7483 0.7501 0.7614 0.7139 0.6265 0.4819 0.3426 0.1922
 0.3541 0.4261 0.5142 0.5720 0.6681 0.7504 0.7826 0.7940 0.7951 0.8026 0.7520 0.6597 0.5109 0.3724 0.2201
 0.4001 0.4774 0.5764 0.6271 0.7145 0.7933 0.8243 0.8334 0.8350 0.8472 0.8006 0.7144 0.5624 0.4205 0.2581
 0.4611 0.5395 0.6448 0.6859 0.7675 0.8350 0.8604 0.8688 0.8683 0.8794 0.8404 0.7620 0.6198 0.4854 0.3046
 0.5134 0.5958 0.7004 0.7350 0.8106 0.8732 0.8955 0.9004 0.8941 0.9081 0.8725 0.8000 0.6627 0.5191 0.3256
 0.5492 0.6297 0.7330 0.7654 0.8446 0.8977 0.9170 0.9186 0.9122 0.9253 0.8935 0.8297 0.6925 0.5460 0.3478
 0.6029 0.6732 0.7650 0.7959 0.8716 0.9176 0.9364 0.9357 0.9318 0.9427 0.9164 0.8591 0.7401 0.6146 0.3976
 0.6502 0.7040 0.7832 0.8087 0.8756 0.9168 0.9365 0.9363 0.9336 0.9416 0.9254 0.8744 0.7606 0.6540 0.4328
 0.6929 0.7369 0.7972 0.8162 0.8781 0.9080 0.9335 0.9338 0.9321 0.9413 0.9278 0.8814 0.7723 0.6738 0.4535
 0.7069 0.7510 0.8083 0.8246 0.8852 0.9098 0.9344 0.9360 0.9353 0.9401 0.9274 0.8824 0.7911 0.7013 0.4599
 0.7500 0.7639 0.8611 0.8889 0.9306 0.9444 0.9583 0.9583 0.9583 0.9583 0.9306 0.8889 0.7639 0.6944 0.4306
which when plotted will look like this :
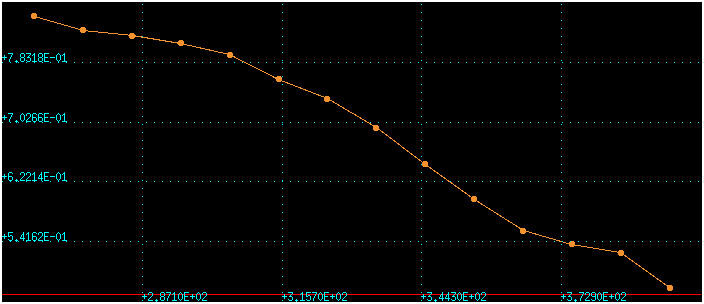
Use the program that follows to calculate the distribution of : [horizontal axis : fraction of frames (of the trajectory) with a given number of residues in a helical conformation (0 → total number of residues)] vs [Vertical axis : Temperature]. As a bonus you'll also get the cumulative helicity vs temperature for a 1D plot.
Percentage of residues in helical conformations vs. temperature
Running the program gives something like this :
 0.1792 0.0000 0.0000 0.0578 0.0173 0.0462 0.1156 0.0405 0.1040 0.1098 0.0636 0.0983 0.0636 0.0520 0.0173 0.0347
 0.1480 0.0000 0.0000 0.0628 0.0250 0.0480 0.0770 0.0606 0.0726 0.0707 0.0970 0.1006 0.0674 0.0604 0.0543 0.0557
 0.1429 0.0000 0.0000 0.0542 0.0201 0.0530 0.0823 0.0600 0.0679 0.0677 0.0905 0.0959 0.0809 0.0707 0.0582 0.0557
 0.1307 0.0000 0.0000 0.0490 0.0160 0.0583 0.0766 0.0540 0.0661 0.0685 0.0919 0.1026 0.0879 0.0789 0.0610 0.0584
 0.1020 0.0000 0.0000 0.0395 0.0127 0.0575 0.0675 0.0483 0.0637 0.0698 0.0919 0.1088 0.1046 0.0873 0.0653 0.0810
 0.0774 0.0000 0.0000 0.0314 0.0097 0.0494 0.0577 0.0396 0.0581 0.0618 0.0917 0.1141 0.1212 0.1018 0.0810 0.1052
 0.0588 0.0000 0.0000 0.0229 0.0064 0.0394 0.0486 0.0297 0.0449 0.0550 0.0929 0.1111 0.1266 0.1204 0.1080 0.1353
 0.0472 0.0000 0.0000 0.0175 0.0040 0.0304 0.0364 0.0239 0.0366 0.0487 0.0848 0.1136 0.1280 0.1344 0.1301 0.1644
 0.0424 0.0000 0.0000 0.0139 0.0041 0.0177 0.0249 0.0231 0.0319 0.0465 0.0773 0.1097 0.1341 0.1486 0.1361 0.1896
 0.0374 0.0000 0.0000 0.0120 0.0028 0.0108 0.0142 0.0162 0.0228 0.0420 0.0665 0.1040 0.1282 0.1500 0.1531 0.2399
 0.0447 0.0000 0.0000 0.0108 0.0024 0.0100 0.0068 0.0123 0.0181 0.0361 0.0509 0.0891 0.1277 0.1389 0.1651 0.2872
 0.0512 0.0000 0.0000 0.0102 0.0016 0.0095 0.0047 0.0112 0.0144 0.0335 0.0362 0.0803 0.1190 0.1227 0.1788 0.3266
 0.0519 0.0000 0.0000 0.0071 0.0009 0.0076 0.0050 0.0103 0.0134 0.0330 0.0349 0.0798 0.1066 0.1120 0.1997 0.3378
 0.0417 0.0000 0.0000 0.0000 0.0000 0.0139 0.0000 0.0000 0.0000 0.0139 0.0417 0.0556 0.1944 0.1250 0.2083 0.3056


395 0.4794
385 0.5265
375 0.5383
365 0.5563
355 0.5983
345 0.6456
335 0.6949
325 0.7338
315 0.7602
305 0.7934
295 0.8089
285 0.8186
275 0.8263
265 0.8454
which can be plotted to give these :


